Discover how early intervention can lead to lifestyle reversal.
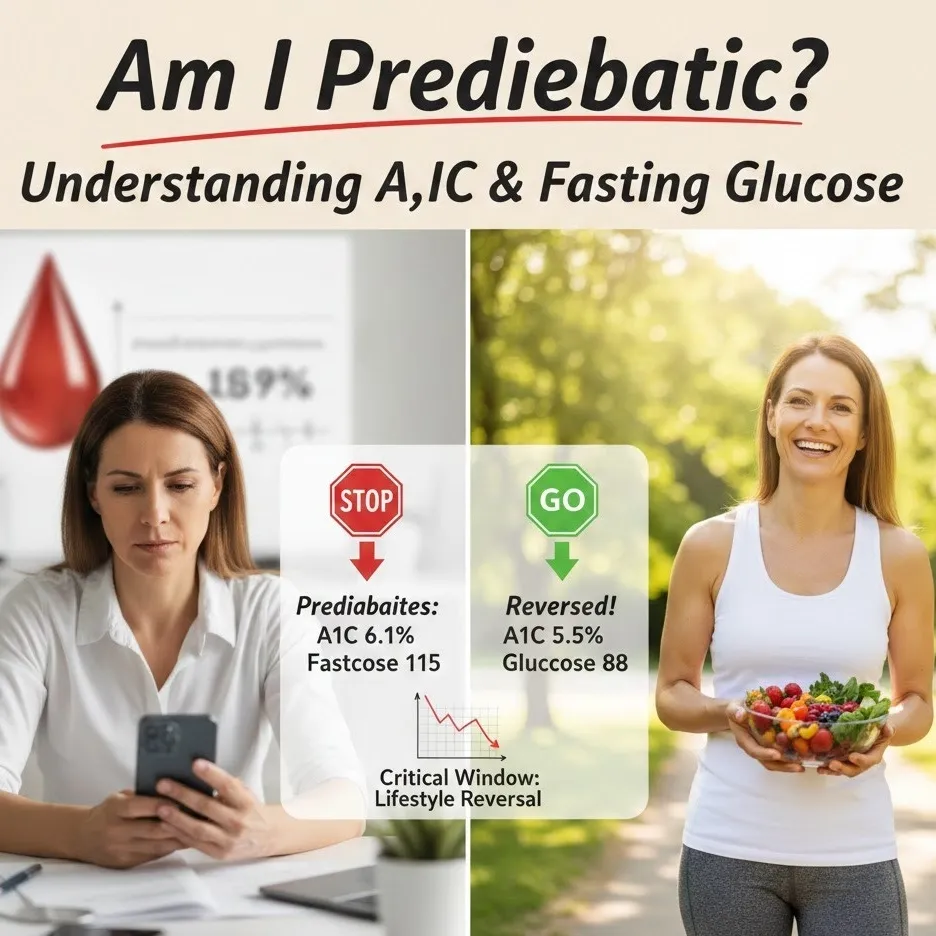
Am I Prediabetic? Understanding A1C and Fasting Glucose
Finding out you have prediabetes can feel like standing at a crossroads. It is a moment of realization that your body is struggling to manage blood sugar, but it is also a powerful window of opportunity. Unlike many chronic conditions, prediabetes is often reversible.
This guide will break down the diagnostic numbers, the subtle prediabetes symptoms to watch for, and how you can use early intervention to reclaim your health.
What is Prediabetes?
Prediabetes is a "warning light" on your body’s dashboard. it means your blood glucose (sugar) levels are higher than normal, but not yet high enough to be classified as Type 2 diabetes.
At this stage, the cells in your body don’t respond normally to insulin—a hormone that lets blood sugar into your cells for energy. Your pancreas tries to keep up by making more insulin, but eventually, it can’t keep the pace, and your blood sugar rises.
The Critical Window for Reversal
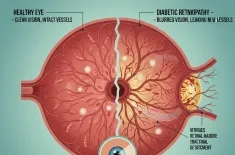
The most important thing to understand about prediabetes is that it is not a permanent diagnosis. It is a transitional state. Research shows that lifestyle reversal strategies—focused on nutrition and movement—can delay or even prevent the progression to Type 2 diabetes. This "critical window" is your chance to reset your metabolism before permanent damage occurs to your vessels and kidneys.
Understanding the Numbers: A1C and Fasting Glucose
To know where you stand, doctors primarily use two tests: the A1C test and the Fasting Plasma Glucose (FPG) test.
1. The A1C Test
The A1C test measures your average blood sugar levels over the past two to three months. It’s like a "batting average" for your blood sugar, rather than a single snapshot in time.
-
Normal: Below 5.7%
-
Prediabetes: 5.7% to 6.4%
-
Diabetes: 6.5% or above
If you have been diagnosed, your primary A1C goal is usually to get back into the "Normal" range (under 5.7%) or, at the very least, stay below the 6.5% threshold.
2. Fasting Blood Sugar (FPG)
The fasting blood sugar test measures your glucose level after you haven't eaten for at least eight hours (usually overnight).
-
Normal: 70–99 mg/dL
-
Prediabetes: 100–125 mg/dL
-
Diabetes: 126 mg/dL or higher
Risk Assessment: Who is at Risk?
Often, prediabetes has no obvious signs. That is why a formal risk assessment is vital. You should consider getting tested if you meet the following criteria:
-
You are overweight or have a high BMI.
-
You are 45 years or older.
-
You have a parent or sibling with Type 2 diabetes.
-
You are physically active less than 3 times a week.
-
You have ever had gestational diabetes (diabetes during pregnancy).
Subtle Prediabetes Symptoms
Most people with prediabetes don’t know they have it because the symptoms develop slowly. However, you should stay alert for:
-
Increased Thirst and Urination: Your kidneys work overtime to filter excess sugar.
-
Fatigue: Even if you’re sleeping well, you may feel "drained" because your cells aren't getting the energy they need.
-
Blurred Vision: High sugar levels can pull fluid from the lenses of your eyes.
-
Darkened Skin (Acanthosis Nigricans): Often appearing on the neck, armpits, or groin, this is a classic sign of insulin resistance.The Path to Lifestyle Reversal
If your numbers fall in the prediabetic range, don't panic. Early intervention is the most effective tool we have. Here is how to start the reversal process:
1. The Power of "5 to 7"
The CDC notes that losing just 5% to 7% of your body weight can reduce the risk of developing Type 2 diabetes by over 50%. For a 200lb person, that is only 10 to 14 pounds.
2. Move More, Sit Less
Aim for at least 150 minutes of moderate activity per week. This doesn't mean you need to run a marathon; brisk walking, swimming, or cycling are excellent ways to make your cells more sensitive to insulin.
3. Smart Nutrition
Focus on whole foods. Replace "white" carbohydrates (white bread, pasta, sugary cereals) with complex fibers like quinoa, leafy greens, and legumes. These slow down the absorption of sugar, preventing the "spikes" that wear out your pancreas.
Summary Table: Diagnostic Ranges
| Category | A1C Level | Fasting Blood Sugar |
| Normal | Below 5.7% | 70–99 mg/dL |
| Prediabetes | 5.7% – 6.4% | 100–125 mg/dL |
| Diabetes | 6.5% or higher | 126 mg/dL or higher |