Discover how AI ophthalmology uses high-resolution retinal analysis to predict cardiovascular disease, stroke risk
The journey from a photograph of the retina to a personalized disease risk score is driven entirely by Artificial Intelligence. The marriage of advanced retinal photography (fundus photography, Optical Coherence Tomography (OCT), and OCT Angiography (OCTA)) with deep learning is known as Oculomics. Oculomics focuses on quantifiable retinal biomarkers that are predictive of systemic health.
How AI-Analysis of High-Resolution Retinal Images Works
Traditional manual retinal analysis relied on clinicians measuring a few key features, such as the Central Retinal Arteriolar Equivalent (CRAE) and Central Retinal Venular Equivalent (CRVE), which are simple indices of vessel narrowing and widening. While effective, this process is time-consuming, prone to human variability, and limited to a few broad metrics.
AI ophthalmology transcends these limitations by employing Deep Learning (DL) models, particularly Convolutional Neural Networks (CNNs). This process can be broken down into three critical steps:
High-Resolution Imaging and Pre-processing
The process begins with obtaining high-resolution imaging of the retina, typically using a standard fundus camera. These images (often color fundus photographs) capture the optic disc, macula, and the intricate vascular tree. The AI model's first task is often pre-processing: denoising, standardizing contrast, and performing precise segmentation—accurately tracing every artery and vein pixel-by-pixel, even in challenging, low-quality images.
Feature Extraction and Quantification
Once the vascular tree is precisely segmented, the AI extracts a massive array of features—far beyond what a human grader could quantify:
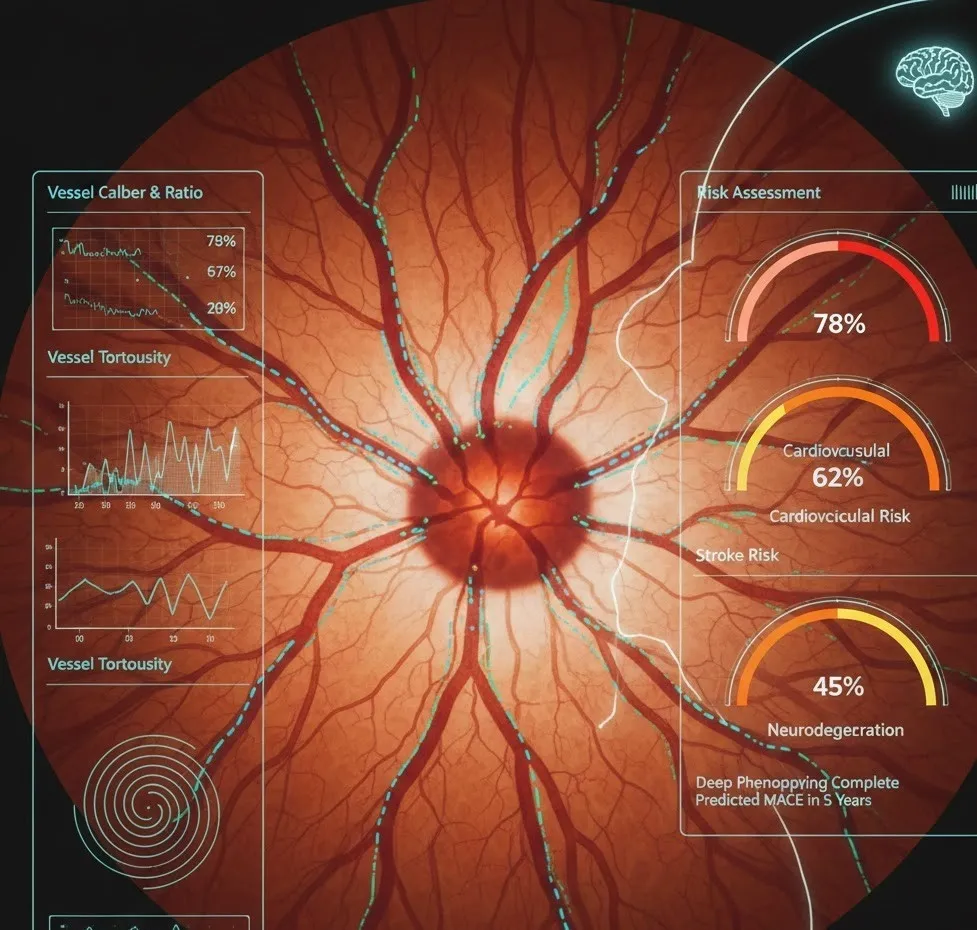
- Vessel Caliber and Ratio: Precise measurements of arteriolar and venular diameters, and the Arteriovenous Ratio (AVR). A reduced AVR often indicates widespread microvascular damage.
- Vessel Tortuosity: A measure of how convoluted or winding the vessels are. Increased tortuosity is a sign of chronic high blood pressure.
- Branching Patterns: Analysis of the fractal dimension, branching angles, and density of the vascular network. Changes here reflect structural degradation and remodeling of the microcirculation.
- Specific Microlesions: Detecting subtle signs like microaneurysms, hemorrhages, cotton-wool spots, and arteriovenous nicking—classic hallmarks of hypertension and diabetes.
Predictive Modeling and Risk Stratification
The quantified data (thousands of metrics per image) is then fed into a DL-based prediction model (e.g., using architectures like EfficientNet or ResNet). The model is trained on vast datasets of retinal images paired with long-term patient health outcomes (e.g., whether the patient suffered a heart attack or stroke five years after the scan). This allows the AI to learn complex, non-linear patterns—or "deep phenotyping"—that connect specific combinations of microvascular features directly to a future health event risk, generating a highly accurate, personalized risk score.
Connecting the Dots: Retinal Biomarkers and Systemic Disease
The reason retinal analysis holds such profound predictive power lies in the shared embryological origins, anatomical continuity, and physiological response mechanisms between the microvasculature of the retina, the heart, and the brain.
Cardiovascular Prediction: The Heart's Shadow in the Eye
Cardiovascular prediction is perhaps the most immediate and clinically mature application of AI-driven retinal analysis. The retinal vessels are often among the first to show changes related to systemic hypertension, arteriosclerosis, and high cholesterol.
- Hypertension and Vessel Narrowing: Sustained high blood pressure causes the retinal arterioles to narrow (Central Retinal Arteriolar Equivalent (CRAE) decreases) as they attempt to protect the fragile capillary beds. Concurrently, the venules may appear wider (Central Retinal Venular Equivalent (CRVE) increases) due to altered blood flow dynamics, resulting in a lower Arteriovenous Ratio (AVR). The AI recognizes these subtle shifts as strong indicators of an increased future risk of Myocardial Infarction (MI) and heart failure.
- Atherosclerosis and Arterial Stiffness: Changes in the retinal vessel walls, such as enhanced arteriolar light reflex (a sign of thickening or "copper wiring"), reflect arterial stiffness—a key precursor to severe Coronary Artery Disease (CAD). The AI integrates these morphological signs to provide a prediction of future Major Adverse Cardiac Events (MACE) with accuracy comparable to, or even surpassing, traditional risk scores like the Framingham Risk Score.
Stroke Risk: Forecasting Cerebrovascular Events
The retinal microvasculature is structurally identical to the microvasculature of the brain. Retinal vessels are, in essence, an accessible extension of the cerebral circulation. Consequently, pathology in the eye is highly predictive of pathology in the brain, making retinal analysis a powerful tool for assessing stroke risk.
- Microvascular Damage and Lacunar Stroke: Retinal signs such as focal arteriolar narrowing, increased venular caliber, and specific branching abnormalities are highly correlated with the presence of microinfarcts and small-vessel disease in the brain, which are the main causes of lacunar strokes.
- Retinal Arteriolar Light Reflex (RALR): Studies show that increased tortuosity and RALR are strongly linked to cerebral small-vessel disease, predicting both ischemic and hemorrhagic stroke subtypes. AI algorithms can identify subtle, diffuse changes across the entire vascular network that indicate widespread systemic endothelial dysfunction, often predicting a stroke event up to a decade in advance.
- Predicting Subtypes: Advanced AI models can even distinguish between ischemic stroke (caused by a clot) and hemorrhagic stroke (caused by a bleed) based on the unique patterns of damage they learn from the high-resolution imaging.
Neurodegeneration: Early Markers for Cognitive Decline
Perhaps the most groundbreaking area is the link between the eye and the brain in neurodegeneration. The retina and the brain share a direct anatomical connection via the optic nerve and a blood-brain barrier-like structure. Neurodegenerative diseases like Alzheimer’s disease and Parkinson’s disease are associated with distinct, measurable changes in the retinal layers, which are picked up by the AI.
- Retinal Nerve Fiber Layer (RNFL) Thinning: Neurodegeneration often involves the loss of neurons in the brain, which is mirrored by the loss of retinal ganglion cells and consequent thinning of the RNFL (a layer of the retina). AI models using OCT and fundus photos can precisely measure this thinning, which correlates with cognitive decline and brain atrophy seen in MRI scans.
- Vascular Impairment in Dementia: Reduced blood flow is a recognized risk factor and symptom of dementia. AI models analyze the density of capillaries and blood flow velocity using non-invasive OCTA to detect early signs of microvascular perfusion deficits, suggesting compromised cerebral blood flow. This offers a potential non-invasive, cost-effective screening tool for people at risk of developing Alzheimer's or vascular dementia years before clinical symptoms manifest.
The Path Forward: Integration and Standardization
The power of retinal analysis powered by AI ophthalmology lies in its scalability and accessibility. Retinal cameras are already standard equipment in optometry and ophthalmology clinics worldwide. Integrating an AI algorithm into this existing workflow allows for a simple, fast, and low-cost cardiovascular prediction and stroke risk assessment to be performed during a routine eye exam. This democratizes access to sophisticated risk assessment, especially in underserved communities where advanced neuroimaging or complex blood panels are expensive or unavailable.
Challenges remain, primarily in achieving regulatory approval, ensuring transparency (the "black box" effect of AI), and integrating the AI-derived risk scores into standardized clinical decision-making protocols. However, with continuous advancements in deep learning models and the creation of larger, multi-center datasets, retinal analysis is poised to become a routine, pivotal component of proactive preventative health screening, transforming how we detect and manage systemic diseases years before they become symptomatic.