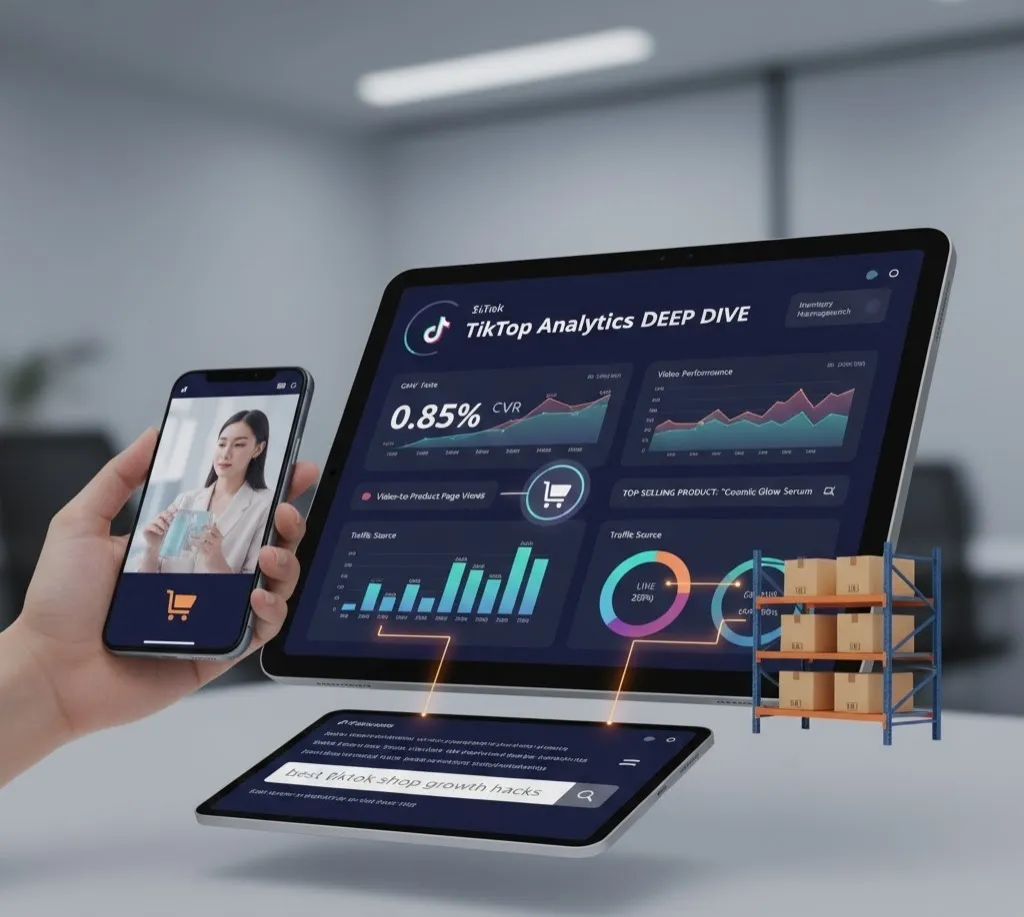
Learn to interpret core metrics: conversion rate, video performance, and traffic source to identify top-selling product and optimize inventory management.
The rise of TikTok Shop has fundamentally changed the landscape of e-commerce, turning short-form videos into powerful storefronts. For brands to capture a piece of this $20 billion market, a superficial understanding of metrics won't suffice. Success demands a **deep dive** into **Shop metrics** to move beyond simple revenue tracking and truly understand customer behavior, content performance, and profit drivers. This comprehensive guide will explain where to find, interpret, and action the key data points that transform views into revenue, with a focus on core metrics like **conversion rate**, **traffic source**, and granular **video performance**.
The Essential TikTok Shop Metrics That Matter
Your entire sales funnel on TikTok Shop—from a user seeing a video to completing a purchase—is trackable within the **Seller Center** under the "Data Compass" and "Sales Analytics" sections. Unlike traditional e-commerce, the key metrics on TikTok are weighted heavily towards content-driven commerce.
Sales & GMV Metrics
These are your high-level financial indicators.
- Gross Merchandise Value (GMV): The total value of all sales before deducting refunds, shipping fees, or taxes. This is your primary measure of overall shop scale.
- Orders & SKU Orders: The total number of transactions and the number of individual product units sold (SKUs). A high Orders-to-SKU Orders ratio can indicate effective upselling/cross-selling or bundled products.
- Average Order Value (AOV): Calculated as $\text{GMV} / \text{Orders}$. A growing AOV is a sign of successful pricing, bundling, or premium product promotion.
- First-Time Buyers: A crucial indicator of your ability to acquire new customers through your content and ads. Monitoring the percentage of first-time buyers against repeat buyers informs your overall growth strategy.
Funnel and Conversion Metrics
This is where the magic of content-driven sales is measured. These metrics show how effectively your content converts viewers into paying customers, culminating in your overall **conversion rate** (Purchases/Product Views).
| Metric | Where to Find (Seller Center) | Interpretation & Action |
|---|---|---|
| Product Views (PV) | Data Compass → Product Analytics | The number of times your product page was viewed. **Action:** A high PV but low conversion means your *product page* is the problem (poor copy, missing reviews, high price). |
| Video-to-Product Page Views (V-t-PV) | Sales Analytics → Video/LIVE Tabs | The number of unique clicks on a product link (the orange cart) from a video, relative to the video’s views. **Interpretation:** The higher, the better. It directly measures the product-link-click-through-rate of your **video performance**. **Action:** If this is low, your video hook, product call-to-action (CTA), or product-video alignment is weak. |
| Conversion Rate (CVR) | Data Compass → Product Analytics (User Conversion Analysis) | $\text{Orders} / \text{Product Views}$. This is the ultimate measure of your product listing's appeal. **Interpretation:** A high V-t-PV with a low CVR means your video got the right person to the page, but the page itself failed to convince them to buy. **Action:** Optimize product images, description, pricing, and social proof (reviews). Industry organic CVR is often between 0.5% and 1.5%. |
| CTOR (Click-Through-Order Rate) | Data Compass (Ad-related reports) | A metric used in ads: $\text{Orders} / \text{Product Details Page Views}$. Measures the efficiency of the final stage of the funnel. |
Deconstructing Traffic Source and Video Performance
Understanding the **traffic source** is critical because it tells you where your best-converting customers are coming from, allowing you to double down on winning channels.
A. Traffic Source Breakdown
TikTok Shop sales generally come from three main sources:
- Short Video: Sales attributed directly to a click on a product link in an organic video.
- LIVE: Sales made during a LIVE session (often the highest converting channel due to urgency and real-time interaction).
- Showcase/Product Page: Sales resulting from users browsing your main **Shop metrics** page, product detail pages, or the shopping window on your profile.
- Affiliate/Creator: Sales driven by other creators promoting your products. This should be analyzed separately to assess the ROI of your creator partnerships.
Actionable Insights:
- If **LIVE** is your top **traffic source** but your short **video performance** is lagging, invest more time and resources into a consistent LIVE strategy.
- If a specific video is driving disproportionately high sales, analyze its core elements (hook, music, demonstration, CTA) and apply those learnings to your future content pipeline.
- The Affiliate channel is a goldmine for scaling. Use the Creator Analytics section in Data Compass to find the **top-selling product** and videos from your affiliates to recruit more creators promoting similar content.
B. Analyzing Video Performance
Beyond the V-t-PV metric, the success of your short **video performance** hinges on these factors:
- View Duration & Completion Rate: TikTok rewards videos that hold attention. A high completion rate (especially for short videos) indicates a powerful hook and engaging narrative. Use the first 3-6 seconds to establish the problem or key benefit.
- Engagement Rate: Likes, comments, and shares. High engagement signals to the algorithm that the content is valuable, boosting its organic reach.
- Product Show Rate (PDP views per video view): This is a key ad metric. A low rate means users are viewing the video but not clicking the product card, indicating a disconnect between the video's message and the product's relevance.
- Sales/GMV per Video: The ultimate measure. Track which videos have the highest dollar value return to guide your content and ad retargeting strategy.
Integrating Analytics with Inventory Management
Sales insights are useless without a strong connection to logistics. Effective **inventory management** on TikTok Shop relies heavily on data from your analytics dashboard.
Key Inventory Metrics to Track:
- Top-Selling Product (TSP) Velocity: Use the Product Analytics in Data Compass to identify your **top-selling product** and calculate their average daily sales rate. This metric is essential for forecasting.
- Stock Turnover Rate: Measures how quickly an item sells out and is replaced. High turnover for a **top-selling product** demands higher safety stock.
- Low Stock Alerts: While some systems offer native alerts, integrating your TikTok Shop data with a third-party inventory or ERP system allows for real-time stock sync and automated alerts. This is critical to prevent the single biggest customer satisfaction killer: overselling.
Actionable Inventory Strategy:
- **Forecast based on Peak Content:** When a video goes viral or a LIVE session generates a huge spike in sales, your **inventory management** system must be ready to scale. Use the Sales Analytics trends to anticipate these spikes and preemptively set higher buffer stock.
- **Optimize the Product Portfolio:** Use the GMV and Refund Rate per SKU to identify profitable *winners* and costly *losers*. A product with a high GMV but an equally high refund rate is a major drain on resources and should be adjusted or delisted. This data-driven pruning optimizes your entire inventory pipeline.
Summary: The Data-Driven Seller
Mastering TikTok Shop is not about luck; it's about disciplined data analysis. The true power lies in the connection between your **video performance** (V-t-PV), your **conversion rate** (CVR), and your **inventory management** system. By moving beyond surface-level **Shop metrics** and digging deep into your Data Compass, you can accurately diagnose funnel problems, identify your next **top-selling product**, and build a profitable, scalable e-commerce brand on the platform.