Learn about distributed tracing, telemetry data, and the shift to complex systems analysis
The evolution of software architecture, particularly the move toward microservices, cloud-native deployments, and serverless computing, has fundamentally challenged traditional methods of system management. This challenge has driven a critical shift from simply watching system health (monitoring) to actively exploring and understanding the state of complex, distributed systems (observability). While often used interchangeably, monitoring and observability represent distinct philosophies that are both essential for maintaining resilient, high-performance applications in the modern digital landscape.
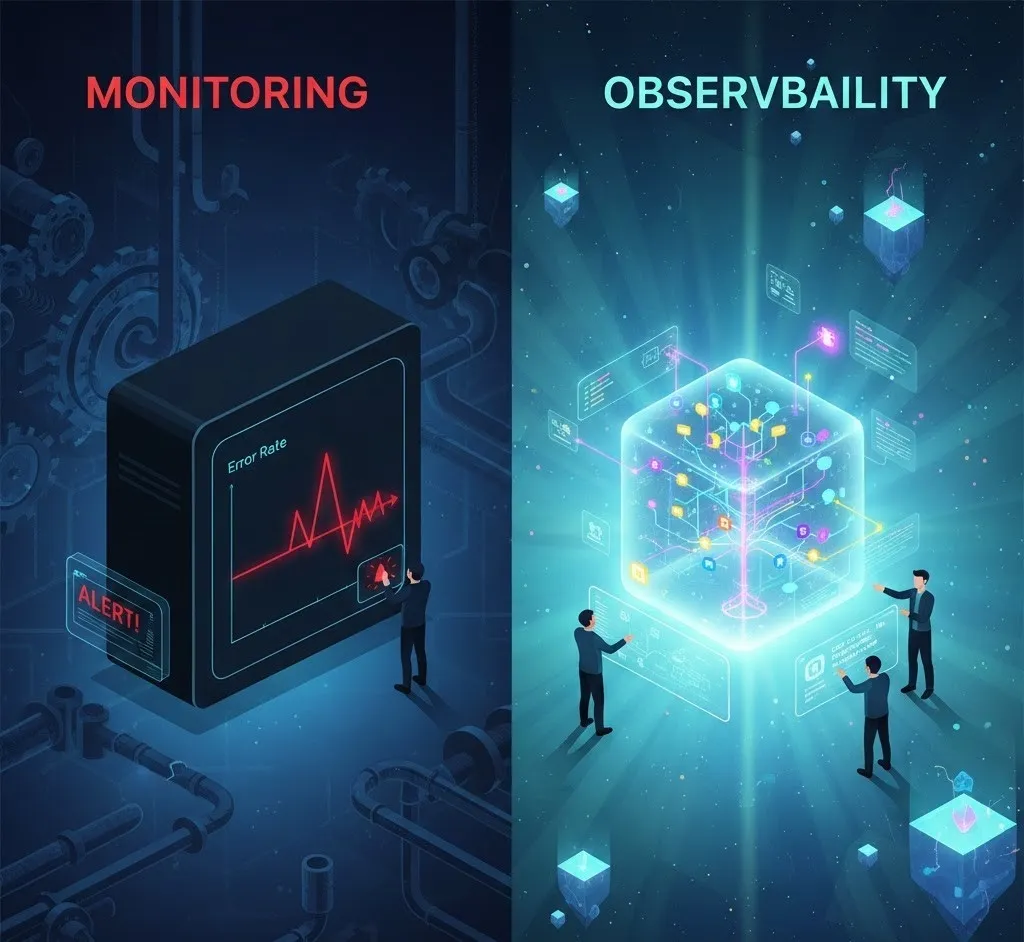
Understanding Monitoring: The "Known Unknowns"
Monitoring is the foundational practice of tracking and collecting predefined metrics to assess the health and performance of a system. It is primarily reactive, designed to answer the question, "Is the system working as expected?"
In a typical monitoring setup, engineers identify key performance indicators (KPIs) and operational metrics—like CPU utilization, error rates, request latency, and memory usage—and set thresholds or baselines for them. When a metric deviates from this expected range, an alert is triggered, notifying a team that a known issue or symptom has occurred.
Key Characteristics of Monitoring:
- Predefined Metrics and Health Checks: Monitoring relies on collecting data points that you knew to measure beforehand. For instance, a basic monitor can be set up to alert if the web server’s response time exceeds 500 milliseconds.
- Dashboards and Alerts: The output of monitoring is often visualized on real-time dashboards and its primary function is to send alerts to signal system degradation or failure.
- Focus on Symptoms: Monitoring tells you what is wrong—e.g., "API latency is high"—but it usually doesn't provide the immediate context or cause for why it's happening.
For simpler, more monolithic applications with predictable failure modes, monitoring is often sufficient. It provides an excellent early warning system, acting as the "smoke alarm" for the system.
Unveiling Observability: The "Unknown Unknowns"
Observability is a property of a system, not just a set of tools. It is the ability to infer the internal state of a system merely by examining the data it outputs. It moves beyond simply tracking known conditions to enabling deep, investigative analysis into unexpected behaviors. In essence, it is designed to answer the questions: "Why did this happen?" and "How do we prevent it from recurring?"
This capability is paramount in modern, interconnected applications—often referred to as complex systems analysis. Because these systems are dynamic, distributed, and have countless potential interaction paths, it is impossible to anticipate every single way they might fail.
The Three Pillars of Observability
Observability relies on three fundamental types of telemetry data working together to provide a complete, holistic view:
- Metrics: Numerical measurements collected over time (e.g., CPU load, request count). They are the core of traditional monitoring but, in an observability context, they are enriched with context and metadata.
- Logs: Timestamped, immutable, and often unstructured or semi-structured records of discrete events that occurred within a service (e.g., an error message, a user login).
- Traces / Distributed Tracing: A detailed record of the path a single user request takes as it flows through all the services in a distributed system. Distributed tracing is the key component that links events across service boundaries, which is crucial for root cause analysis in microservices where a single transaction may touch dozens of components.
Observability as an Exploratory Tool
The power of Observability lies in its capacity for exploration. Unlike monitoring, which only provides insights into the metrics you’ve defined, a truly observable system allows engineers to ask arbitrary, unanticipated questions about the system's internal state in real-time.
For example, if an application begins experiencing slow performance, monitoring might alert on a high error rate in one service. With observability, an engineer can then:
- Use distributed tracing to find the specific requests causing the error.
- Use the trace ID to correlate relevant logs from the service at that exact timestamp.
- Correlate that data with the service's metrics to see resource contention.
This flexible, ad-hoc querying ability is what makes observability the detective for the "unknown unknowns"—issues that were never anticipated or defined as a monitorable condition.
The Complementary Relationship
While Observability is the goal, monitoring is a critical component for achieving it. You cannot have true observability without effective monitoring.
- Monitoring acts as the alert system. It defines the "normal" state and screams when a known metric—like high latency or low disk space—is breached. This is vital for maintaining service level objectives (SLOs).
- Observability acts as the debugger/investigator. When a monitoring alert is too vague to determine a root cause, the observability platform allows the engineer to dive deep into the logs, traces, and metrics to find the why.
By utilizing both practices, development and operations teams can:
- Reduce Mean Time to Detect (MTTD): Monitoring instantly alerts the team to the problem.
- Reduce Mean Time to Resolution (MTTR): Observability provides the tools to quickly identify the root cause, leading to faster fixes and preventing recurrence.
The ultimate vision is a unified platform that collects all telemetry data, allows for flexible exploration (Observability), and enables the creation of specific alerts on known conditions (Monitoring). This holistic approach ensures not only that teams are aware of system failures but that they are equipped to diagnose and prevent even the most unpredictable and intricate issues that arise in today's complex systems analysis environments.
The Future: Observability for Business Value
As systems continue to increase in complexity, Observability is rapidly becoming an indispensable discipline—not just for Site Reliability Engineers (SREs) and DevOps teams, but for the entire business. By offering deep insights into the why behind system behavior, it informs architectural decisions, optimizes resource consumption, and directly improves customer experience. The ability to quickly debug an issue using distributed tracing and rich telemetry data is now a competitive advantage, ensuring systems remain robust and highly available in a world built on intricate, interconnected distributed systems.